Properties of estimators
Sep 26, 2024
Announcements
Project
Research questions due TODAY
Proposal due Thursday, October 3 at 11:59pm
Lab 03 due Thursday, October 3 at 11:59pm
HW 02 due Thursday, October 3 at 11:59pm (released after class)
Statistics experience due Tue, Nov 26 at 11:59pm
Topics
Compute and interpret confidence interval for a single coefficient
Properties of \(\hat{\boldsymbol{\beta}}\)
Define “linear” model
Computing setup
Data: NCAA Football expenditures
Today’s data come from Equity in Athletics Data Analysis and includes information about sports expenditures and revenues for colleges and universities in the United States. This data set was featured in a March 2022 Tidy Tuesday.
We will focus on the 2019 - 2020 season expenditures on football for institutions in the NCAA - Division 1 FBS. The variables are :
total_exp_m: Total expenditures on football in the 2019 - 2020 academic year (in millions USD)enrollment_th: Total student enrollment in the 2019 - 2020 academic year (in thousands)type: institution type (Public or Private)
Regression model
Inference for \(\beta_j\)
We often want to conduct inference on individual model coefficients
Hypothesis test: Is there a linear relationship between the response and \(x_j\)?
Confidence interval: What is a plausible range of values \(\beta_j\) can take?
Confidence interval for \(\beta_j\)
Confidence interval for \(\beta_j\)
A plausible range of values for a population parameter is called a confidence interval
Using only a single point estimate is like fishing in a murky lake with a spear, and using a confidence interval is like fishing with a net
We can throw a spear where we saw a fish but we will probably miss, if we toss a net in that area, we have a good chance of catching the fish
Similarly, if we report a point estimate, we probably will not hit the exact population parameter, but if we report a range of plausible values we have a good shot at capturing the parameter
What “confidence” means
We will construct \(C\%\) confidence intervals
- The confidence level impacts the width of the interval
“Confidence” means if we were to take repeated samples of the same size as our data, fit regression lines using the same predictors, and calculate \(C\%\) CIs for the coefficient of \(x_j\), then \(C\%\) of those intervals will contain the true value of the coefficient \(\beta_j\)
Need to balance precision and accuracy when selecting a confidence level
Confidence interval for \(\beta_j\)
\[ \text{Estimate} \pm \text{ (critical value) } \times \text{SE} \]
\[ \hat{\beta}_1 \pm t^* \times SE({\hat{\beta}_j}) \]
where \(t^*\) is calculated from a \(t\) distribution with \(n-p-1\) degrees of freedom
Computing \(t^*\) in R
95% CI for coefficient of enrollment
| term | estimate | std.error | statistic | p.value |
|---|---|---|---|---|
| (Intercept) | 19.332 | 2.984 | 6.478 | 0 |
| enrollment_th | 0.780 | 0.110 | 7.074 | 0 |
| typePublic | -13.226 | 3.153 | -4.195 | 0 |
\[ \hat{\beta}_j \pm t^* \times SE(\hat{\beta}_j) \]
\[ 0.7804 \pm 1.9793 \times 0.1103 \]
\[ [0.562, 0.999] \]
Interpreting the CI
Computing CI in R
Properties of \(\hat{\boldsymbol{\beta}}\)
Motivation
We have discussed how to use least squares to find an estimator of \(\hat{\boldsymbol{\beta}}\)
How do we know whether our least squares estimator is a “good” estimator?
When we consider what makes an estimator “good”, we’ll look at three criteria:
- Bias
- Variance
- Mean squared error
We’ll take a look at these over the course of a few lectures and motivate why we might prefer using least squares to compute \(\hat{\boldsymbol{\beta}}\) versus other methods
Bias and variance
Suppose you are throwing darts at a target
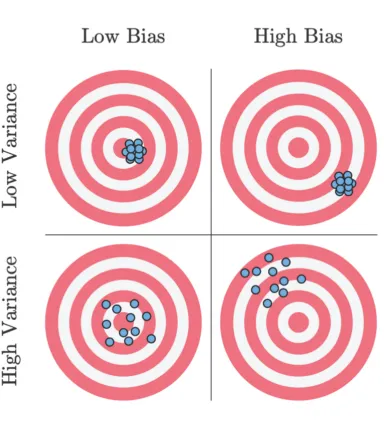
Unbiased: Darts distributed around the target
Biased: Darts systematically away from the target
Variance: Darts could be widely spread (high variance) or generally clustered together (low variance)
Bias and variance
Ideal scenario: Darts are clustered around the target (unbiased and low variance)
Worst case scenario: Darts are widely spread out and systematically far from the target (high bias and high variance)
Acceptable scenario: There’s some trade-off between the bias and variance. For example, it may be acceptable for the darts to be clustered around a point that is close to the target (low bias and low variance)
Bias and variance
Each time we take a sample of size \(n\), we can find the least squares estimator (throw dart at target)
Suppose we take many independent samples of size \(n\) and find the least squares estimator for each sample (throw many darts at the target). Ideally,
The estimators are centered at the true parameter (unbiased)
The estimators are clustered around the true parameter (unbiased with low variance)
Let’s take a look at the mean and variance of the least squares estimator
Expected value of \(\hat{\boldsymbol{\beta}}\)
The bias of an estimator is the difference between the estimator’s expected value and the true value of the parameter
Let \(\hat{\theta}\) be an estimator of the parameter \(\theta\). Then
\[ Bias(\hat{\theta}) = E(\hat{\theta}) - \theta \]
An estimator is unbiased if the bias is 0 and thus \(E(\hat{\theta}) = \theta\)
Finding expected value and variance
Let \(\mathbf{A}\) be a \(n \times p\) matrix of constants and \(\mathbf{b}\) a \(p \times 1\) vector of random variables. Then
\[ E(\mathbf{Ab}) = \mathbf{A}E(\mathbf{b}) \]
\[ Var(\mathbf{Ab}) = \mathbf{A}Var(\mathbf{b})\mathbf{A}^T \]
Expected value of \(\hat{\boldsymbol{\beta}}\)
Let’s take a look at the expected value of the least squares estimator. Given \(E(\boldsymbol{\epsilon}) = \mathbf{0}\),
\[ \begin{aligned} E(\hat{\boldsymbol{\beta}}) &= E[(\mathbf{X}^T\mathbf{X})^{-1}\mathbf{X}^T\mathbf{y}] \\[8pt] & = \class{fragment}{E[(\mathbf{X}^T\mathbf{X})^{-1}\mathbf{X}^T(\mathbf{X}\boldsymbol{\beta} + \mathbf{\epsilon})]} \\[8pt] & = \class{fragment}{E[(\mathbf{X}^T\mathbf{X})^{-1}\mathbf{X}^T\mathbf{X}\boldsymbol{\beta}] + E[(\mathbf{X}^T\mathbf{X})^{-1}\mathbf{X}^T\boldsymbol{\epsilon}]}\\[8pt] & = \class{fragment}{\boldsymbol{\beta} + (\mathbf{X}^T\mathbf{X})^{-1}\mathbf{X}^TE(\boldsymbol{\epsilon})} \\[8pt] & = \class{fragment}{\boldsymbol{\beta}} \end{aligned} \]
Expected value of \(\hat{\boldsymbol{\beta}}\)
The least squares estimator \(\hat{\boldsymbol{\beta}}\) is an unbiased estimator of \(\boldsymbol{\beta}\)
\[ E(\hat{\boldsymbol{\beta}}) = \boldsymbol{\beta} \]
Now let’s take a look at the variance
Variance of \(\hat{\boldsymbol{\beta}}\)
\[ \begin{aligned} Var(\hat{\boldsymbol{\beta}}) &= Var((\mathbf{X}^T\mathbf{X})^{-1}\mathbf{X}^T\mathbf{y}) \\[8pt] & = \class{fragment}{[(\mathbf{X}^T\mathbf{X})^{-1}\mathbf{X}^T]Var(\mathbf{y})[(\mathbf{X}^T\mathbf{X})^{-1}\mathbf{X}^T]^T }\\[8pt] & = \class{fragment}{[(\mathbf{X}^T\mathbf{X})^{-1}\mathbf{X}^T]\sigma^2_{\epsilon}\mathbf{I}[\mathbf{X}(\mathbf{X}^T\mathbf{X})^{-1}]} \\[8pt] & = \class{fragment}{\sigma^2_{\epsilon}[(\mathbf{X}^T\mathbf{X})^{-1}\mathbf{X}^T\mathbf{X}(\mathbf{X}^T\mathbf{X})^{-1}]} \\[8pt] & = \class{fragment}{\sigma^2_{\epsilon}(\mathbf{X}^T\mathbf{X})^{-1}} \end{aligned} \]
Variance of \(\hat{\boldsymbol{\beta}}\)
\[ Var(\hat{\boldsymbol{\beta}}) = \sigma^2_{\epsilon}(\mathbf{X}^T\mathbf{X})^{-1} \]
We will show that \(\hat{\boldsymbol{\beta}}\) is the “best” estimator (has the lowest variance) among the class of linear unbiased estimators
What do we mean by “linear”?
“Linear” regression model
What does it mean for a model to be a “linear” regression model?
Linear regression models are linear in the parameters, i.e. given an observation \(y_i\)
\[ y_i = \beta_0 + \beta_1f_1(x_{i1}) + \dots + \beta_pf_p(x_{ip}) + \epsilon_i \]
The functions \(f_1, \ldots, f_p\) can be non-linear as long as \(\beta_0, \beta_1, \ldots, \beta_p\) are linear in \(Y\)
Identify the linear regression model
Identify the linear regression model
\(y_i = \beta_0 + \beta_1x_{i1} + \beta_2x_{i1}^2 + \beta_3x_{i2} + \epsilon_i\)
\(y_i = \beta_1x_{i1} + \beta_2x_{i2} + \beta_3x_{i1}x_{i2} + \epsilon_i\)
\(y_i = \beta_0 + \beta_1\sin(x_{i1} + \beta_2x_{i2}) + \beta_3x_{i3} + \epsilon_i\)
\(y_i = \beta_0 + \beta_1e^{x_{i1}} + \beta_2e^{x_{i2}} + \epsilon_i\)
\(y_i = \exp(\beta_0 + \beta_1x_{i1} + \beta_2x_{i2} + \beta_3x_{i3}) + \epsilon_i\)
Recap
Computed and interpreted confidence interval for a single coefficient
Showed some properties of \(\hat{\boldsymbol{\beta}}\)
Defined “linear” model